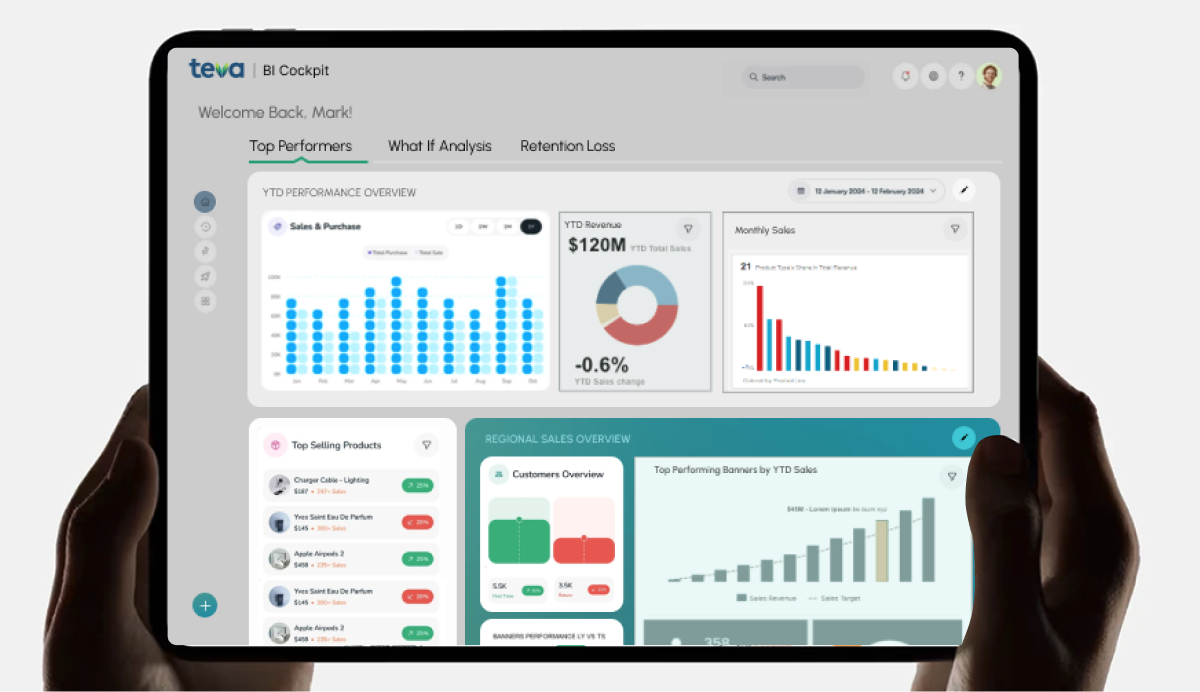
Teva Pharmaceutical’s custom dashboard for real‑time what‑if analysis and seamless data integration. It needed to be modular, intuitive, and user‑centered—enabling faster, data‑driven decisions across laptops and tablets.
View More Projects
ipad
Tablet View
Dashboard Serving as Home
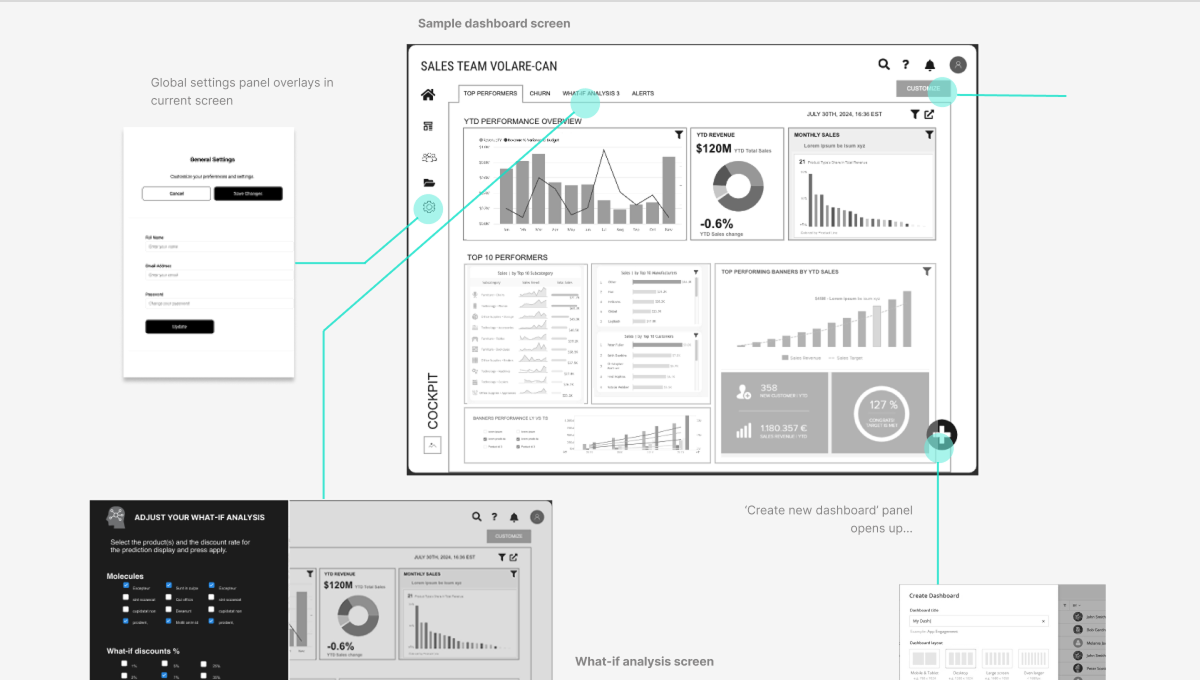
wireflows
interaction design
Wireframes and Wireflows
test results
User research
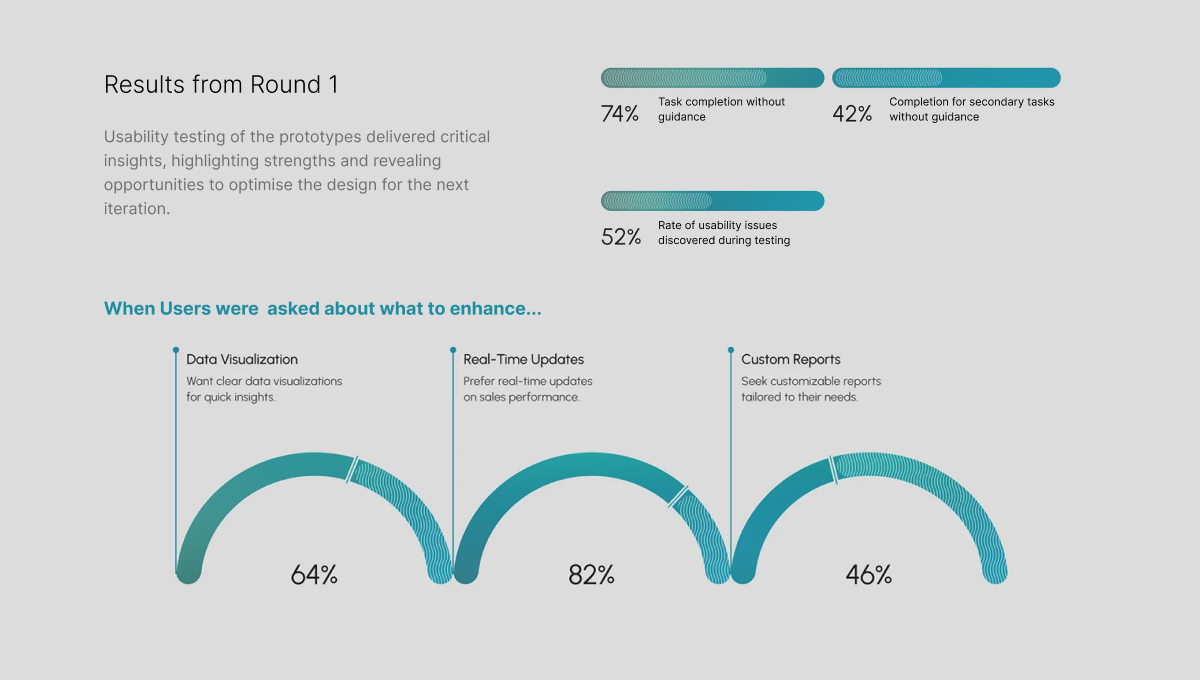
Usability Test Results
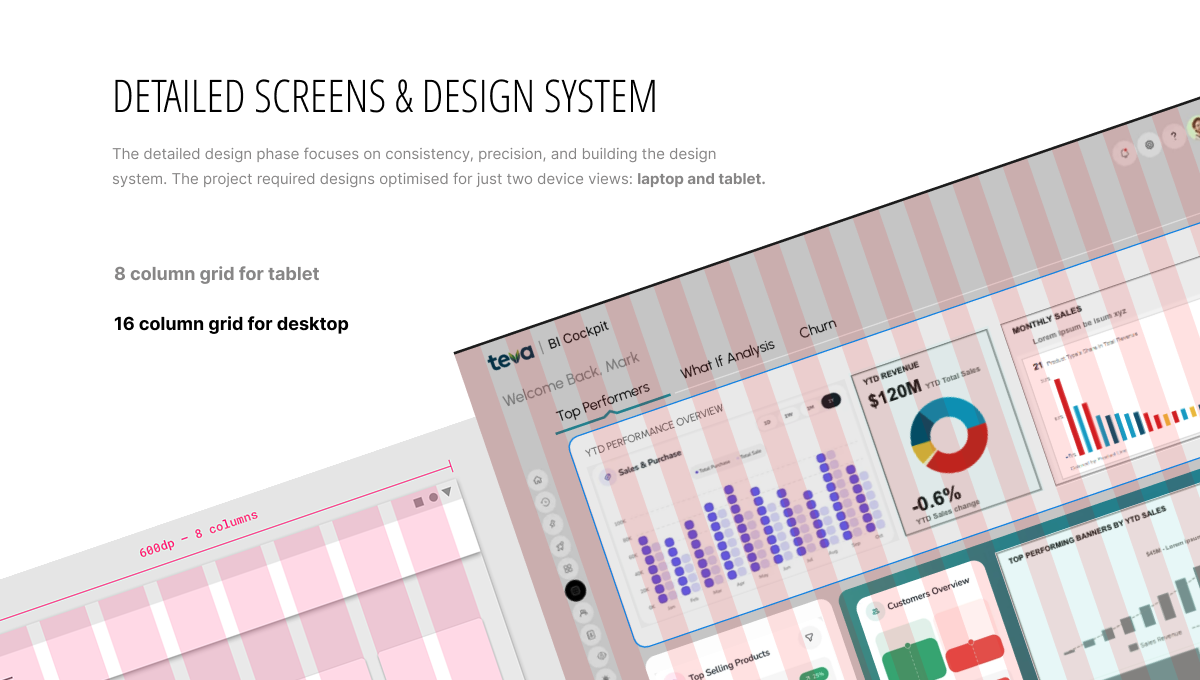
Grids
design system
Grids to Ensure Responsiveness
Components
Design system
Working with Components
Other screens
visual design
More Screens
test results
Tablet view
What-If Analysis Interface
test results
Concept mockup
How It Will Be Used
The Problem to Solve
Teva struggled to manage and analyze large operational and sales data streams. Off‑the‑shelf tools (Tableau, Power BI) didn’t fit the needs of regional CEOs, sales directors, and analysts. They needed a bespoke dashboard that:
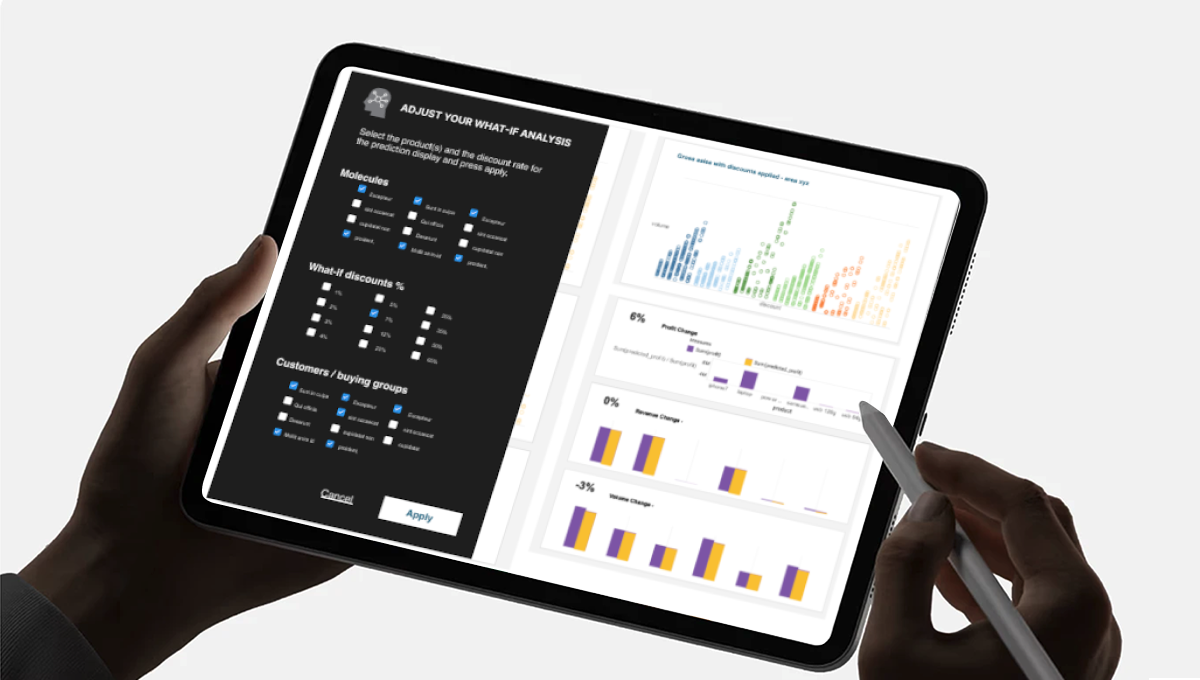
Enables real-time “what‑if” analysis for operational and sales data
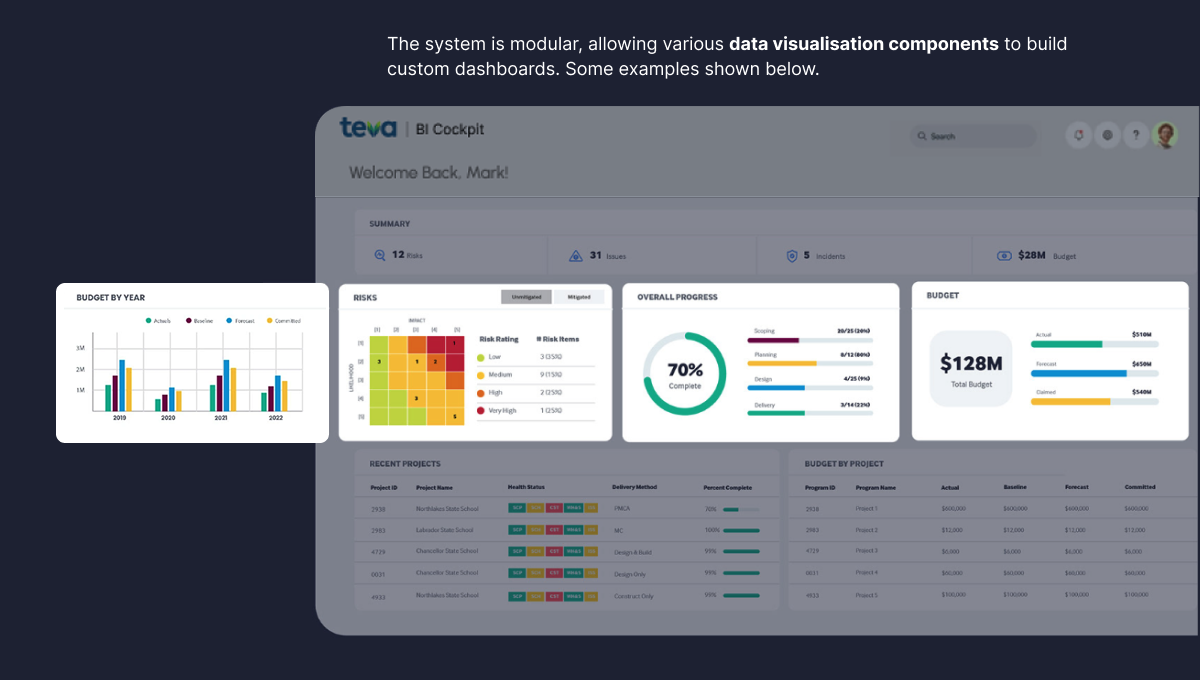
Uses a modular system for tailored visualizations
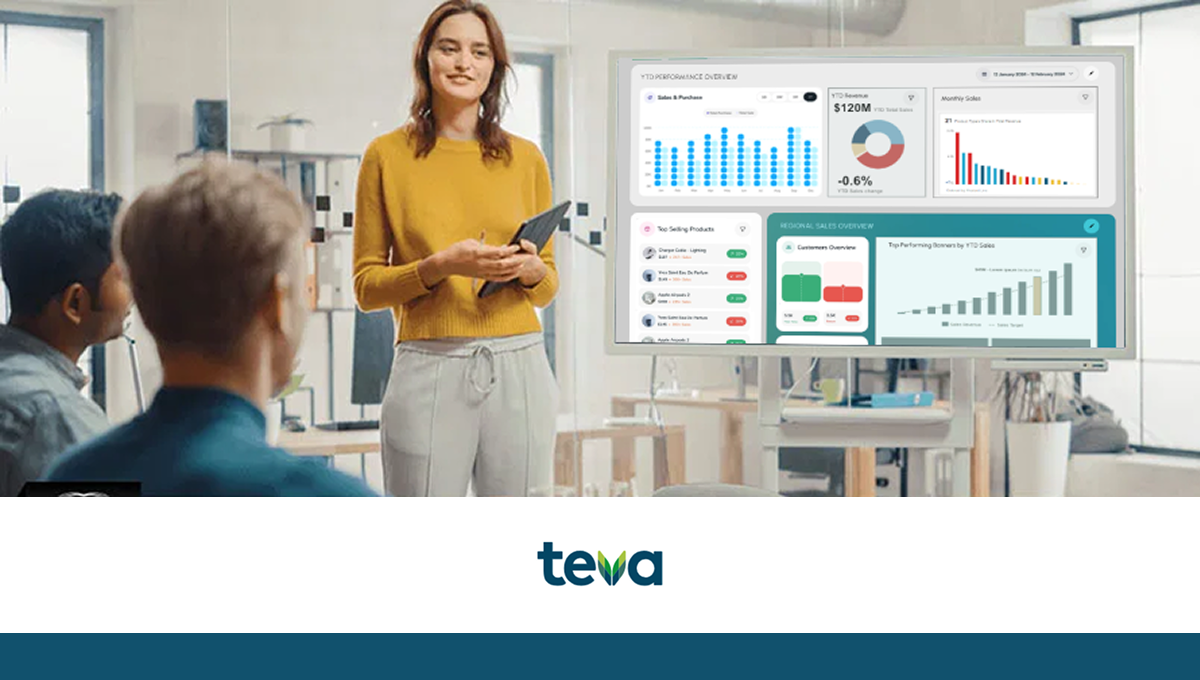
Works seamlessly on laptops and tablets for mobile workflows
Our Approach: Iterative, Modular, User‑Tested
We started with lo‑fi wireframes to map modules and visualizations to real tasks, then moved to mid‑fi screens and clickable prototypes for rapid user testing. Feedback refined flows and micro‑interactions.
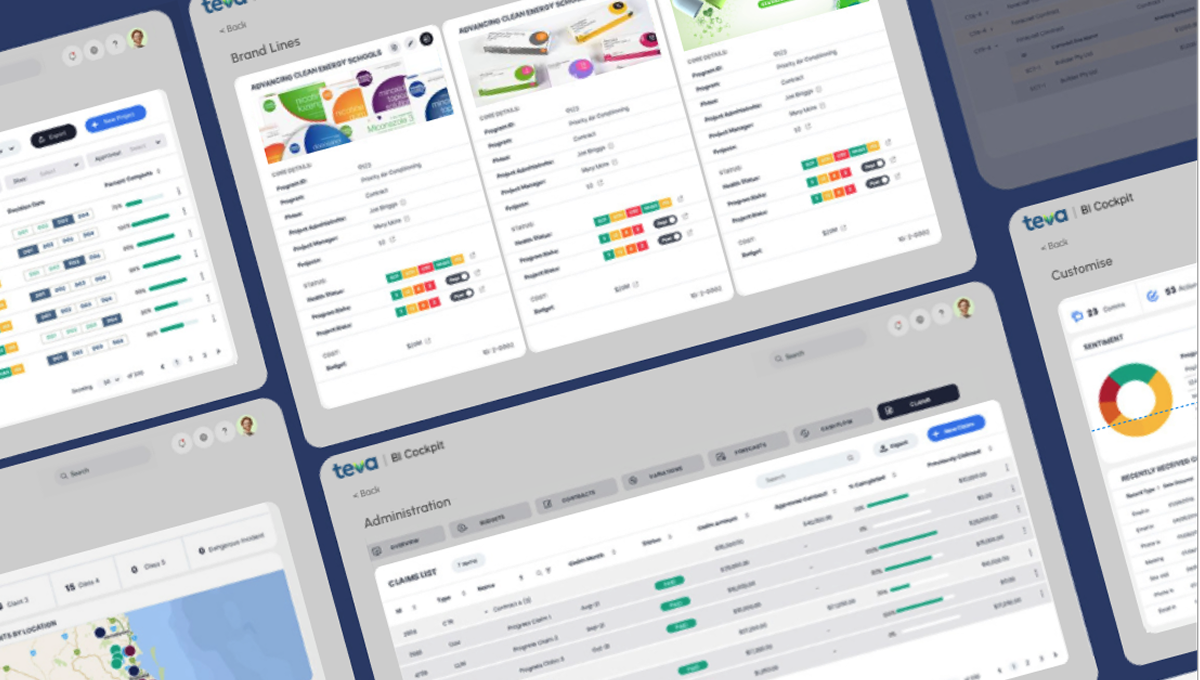
We designed a modular system so users could assemble custom dashboards from reusable components—Top Performers for trends, What‑If Analysis for scenarios—optimized for laptops and tablets to support mobile, collaborative workflows.
Result: Intuitive and Flexible
Users got an interface that feels natural and adapts to their needs. Custom dashboards surface the right metrics, while What‑If tools supported scenario planning without losing context.
The outcome was faster insight, smoother decisions, and dashboards tailored to diverse roles—regional leaders, sales directors, and analysts alike.
Deliverables
User personas & streamlined user flows and wireframes for data nav and real-time what‑if analysis
Mid‑fi prototypes user‑tested to refine interactions
Modular design system with reusable visualization components
Usability testing findings from workshops and interviews
Recommendations for modular dashboards to support collaboration and diverse needs